


- Car Crashes in the US: Types and Statistics
- Rear Collisions
- T-bone Accidents
- Head-On Collisions
- Single-Vehicle Accidents
- Multiple-vehicle Collisions
- Pedestrian and Cyclist Accidents
- Current Crash Statistics in the U.S.
- Can Anything Be Done?
- Consider the Effects of Collisions on Vehicles
- Crash and Accident Stats by State
Car Crashes in the US: Types and Statistics

In the United States, car accidents remain a serious public health issue, affecting not just the people directly involved but their families and communities. Understanding the different types of crashes on American roads, along with current data on how often they happen, helps put the scale of the problem into perspective. Below is a breakdown of the most common crash types, the latest national statistics, and what's actually working to bring the numbers down. Let's start with the different types of crashes on U.S. roads.Rear-end collision
Rear Collisions
Rear-end collisions remain one of the most common types of crashes on U.S. roads. These happen when one vehicle strikes another from behind, typically due to tailgating, distracted driving, or sudden stops. According to the National Highway Traffic Safety Administration (NHTSA), rear-end crashes account for roughly 28.5% of all traffic accidents in the U.S. While many rear-end collisions cause only minor damage, high-speed impacts can result in serious injuries such as whiplash or worse.
T-bone Accidents
T-bone collisions, also called side-impact collisions, happen when the front of one vehicle strikes the side of another, often at intersections or when a driver fails to yield. Common causes include driver error, speeding, and impaired driving. Side-impact crashes make up a relatively small share of total crashes, but they're disproportionately deadly — the Insurance Institute for Highway Safety (IIHS) reports that side-impact crashes caused about 22% of passenger vehicle occupant deaths in 2023, despite representing under 3% of all crashes. Occupants on the impact side of the vehicle face the highest risk of serious injury
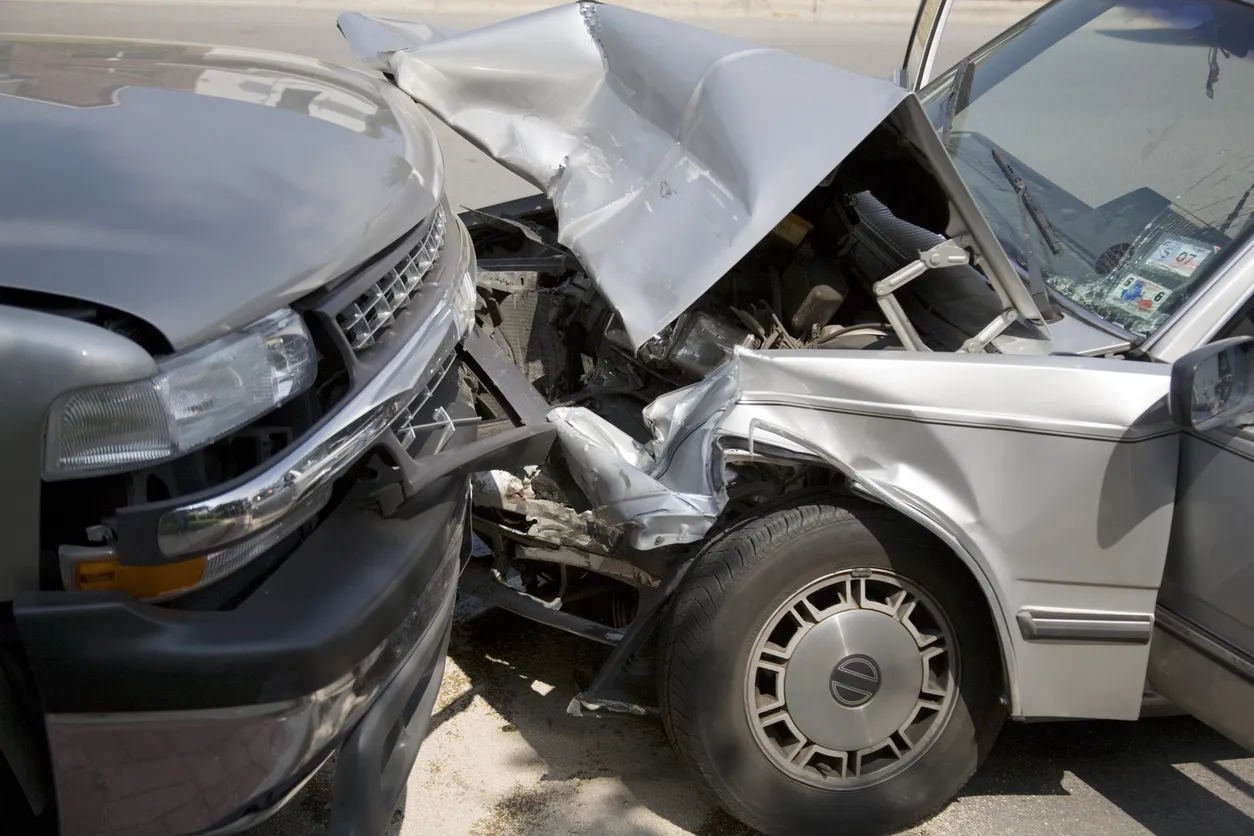
Head-On Collisions
A head-on collision occurs when two vehicles traveling in opposite directions collide, most often on two-lane roads when a driver crosses the center line or loses control. Head-on collisions remain among the deadliest crash types due to the combined speed of impact.
Single-Vehicle Accidents
Single-vehicle crashes happen when a car rolls over or strikes an object such as a tree, guardrail, or pole, without another vehicle involved. Common causes include driver error, speeding, and poor weather conditions. These crashes can range from minor to fatal, and rollover crashes in particular are disproportionately deadly, especially for unrestrained occupants. In 2023, NHTSA data showed that among passenger vehicle occupants killed in crashes, rollover-involved deaths were highest for pickups (38%), followed by SUVs (33%), vans (25%), and passenger cars (20%).
Multiple-vehicle Collisions
Multi-vehicle collisions involve three or more vehicles and often occur on fast-moving roads or highways. Causes range from driver error to poor weather or road conditions. These crashes can be especially dangerous in chain-reaction scenarios involving high-speed traffic.
Pedestrian and Cyclist Accidents
Pedestrians and cyclists remain especially vulnerable on U.S. roads. According to NHTSA, 7,314 pedestrians were killed in traffic crashes in 2023. Contributing factors include driver error, impaired driving, and poor visibility, particularly at night.

Current Crash Statistics in the U.S.
Nationally, traffic crash trends have actually been improving in recent years. According to NHTSA's most recent full-year data (2023):
- There were 40,901 traffic fatalities in 2023, a 4.3% decrease from 42,721 in 2022.
- An estimated 6,138,359 police-reported crashes occurred in 2023, and about 2,442,581 people were injured.
- The fatality rate per 100 million vehicle miles traveled dropped to 1.26 in 2023, down from 1.34 in 2022.
- Speeding-related crashes caused 11,775 deaths in 2023, about 29% of all traffic fatalities.
- Alcohol-impaired driving caused 12,429 deaths in 2023, down 7.6% from 2022.
This marks the second consecutive year of declining fatalities after a sharp rise during 2020–2021, even as the number of police-reported crashes and total miles driven both increased. In other words, more people are driving, but crashes are becoming somewhat less deadly on average.
Can Anything Be Done?
Keep as-is structurally - the advice (defensive driving, avoiding distractions, safe following distance, ADAS technology) is still accurate and doesn't need factual updates. Just update the CDC link if it's returned a 404 (worth checking, since it's an old link).

Together with these strategies, it's crucial to take into account how vehicle accidents affect the people involved and their loved ones. The physical, emotional, and financial toll for people who are hurt or killed in collisions may be high. The effect on their loved ones may be just as severe, with many families finding it difficult to deal with the fallout from such tragedies.
Consider the Effects of Collisions on Vehicles
There is no doubt that vehicle accidents are a serious issue in the US, where tens of thousands of people die each year. While some collisions are just marginally detrimental to the persons involved and their loved ones, others can be disastrous. We can endeavor to lower the frequency of collisions and make American roads safer for everyone by adopting measures to promote defensive driving practices, make investments in safety technologies, and provide assistance to individuals who are impacted by collisions.
It is also essential to keep in mind that when you are buying a vehicle, it may have been in an accident before you bought it. Let the experts here at GoodCar help you get peace of mind by running a vehicle history report so you can be sure you know the condition of the vehicle you are buying!
Crash and Accident Stats by State
| State | Fatal Crashes | Deaths per 100,000 population | Crash Type | Alcohol Involvement |
|---|---|---|---|---|
| Alabama | 885 | 19.5 | 983 | 549 |
| Alaska | 1,063 | 16.2 | 67 | 25 |
| Arizona | 1,063 | 16.2 | 1,180 | 426 |
| Arkansas | 631 | 22.9 | 693 | 347 |
| California | 3,983 | 10.9 | 4,285 | 1,760 |
| Colorado | 638 | 11.9 | 691 | 325 |
| Connecticut | 283 | 8.2 | 298 | 148 |
| Delaware | 132 | 13.5 | 136 | 57 |
| Florida | 3,451 | 17.1 | 3,738 | 1,429 |
| Georgia | 1,670 | 16.7 | 1,797 | 922 |
| Hawaii | 94 | 6.5 | 94 | 20 |
| Idaho | 244 | 14.2 | 271 | 143 |
| Illinois | 1,210 | 10.5 | 1,334 | 646 |
| Indiana | 863 | 13.7 | 932 | 484 |
| Iowa | 356 | 11.1 | 356 | 169 |
| Kansas | 381 | 14.4 | 424 | 240 |
| Kentucky | 734 | 17.9 | 806 | 429 |
| Louisiana | 887 | 21.0 | 972 | 487 |
| Maine | 135 | 11.1 | 153 | 82 |
| Maryland | 522 | 9.1 | 561 | 260 |
| Massachusetts | 397 | 6.0 | 417 | 202 |
| Michigan | 1,072 | 11.3 | 1,136 | 544 |
| Minnesota | 451 | 8.5 | 488 | 257 |
| Mississippi | 697 | 26.2 | 772 | 456 |
| Missouri | 931 | 16.5 | 1,016 | 515 |
| Montana | 222 | 21.6 | 239 | 136 |
| Nebraska | 192 | 11.3 | 221 | 136 |
| Nevada | 360 | 12.2 | 385 | 143 |
| New Hampshire | 106 | 8.5 | 118 | 62 |
| New Jersey | 669 | 7.5 | 699 | 260 |
| New Mexico | 427 | 22.7 | 481 | 197 |
| New York | 1,099 | 5.8 | 1,157 | 430 |
| North Carolina | 1,535 | 15.7 | 1,663 | 899 |
| North Dakota | 85 | 13.0 | 101 | 899 |
| Ohio | 1,242 | 11.5 | 1,354 | 662 |
| Oklahoma | 681 | 19.1 | 762 | 408 |
| Oregon | 552 | 14.1 | 599 | 306 |
| Pennsylvania | 1,153 | 9.5 | 1,230 | 568 |
| Rhode Island | 61 | 5.7 | 63 | 32 |
| South Carolina | 1,112 | 23.1 | 1,198 | 607 |
| South Dakota | 131 | 16.5 | 148 | 79 |
| Tennessee | 1,229 | 19.0 | 1,327 | 709 |
| Texas | 4,068 | 15.2 | 4,498 | 2,118 |
| Utah | 293 | 9.8 | 328 | 153 |
| Vermont | 69 | 11.4 | 74 | 39 |
| Virginia | 906 | 11.2 | 973 | 531 |
| Washington, D.C. | 40 | 6.1 | 41 | 9 |
| Washington | 603 | 8.7 | 670 | 531 |
| West Virginia | 257 | 15.7 | 280 | 146 |
| Wisconsin | 572 | 10.5 | 620 | 317 |
| Wyoming | 102 | 19.0 | 110 | 59 |
- Car Crashes in the US: Types and Statistics
- Rear Collisions
- T-bone Accidents
- Head-On Collisions
- Single-Vehicle Accidents
- Multiple-vehicle Collisions
- Pedestrian and Cyclist Accidents
- Current Crash Statistics in the U.S.
- Can Anything Be Done?
- Consider the Effects of Collisions on Vehicles
- Crash and Accident Stats by State
Related Topics


FREE Vehicle Search
- Accidents
- Problem Checks
- Title Records
- Recalls
- Values
- Specs


-
 InfoPay, Inc. (dba GoodCar) is an Approved NMVTIS Data Provider
-

-
